- To capture the range of variability
over planning horizons of different length, sequences of
30-, 20- 11-, and 7-years were selected.
- A data spreadsheet which included the quantile
visualization of both the Upper Colorado River and S+V+T
was used since future water availability depends on both
basins and the synchrony of their high and low extremes.
- Plots of the reconstructed time series of both UCRB
& SVT using 30-year, 20-year, and 7-year filters were
examined to identify extreme and unique periods of
streamflow behavior that emerged at each of these time
scales.
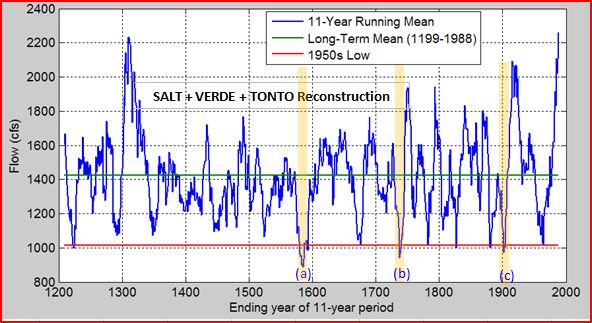
- A different approach was taken for identifying
unique 11-year sequences in the SVT, to take advantage
of its longer reconstructed record. Using the
1950's drought as a an "11-year drought benchmark" in
the gaged record, earlier periods in the filtered
reconstructed SVT flow were identified that were equal
or lower in flow than the 20th century benchmark.
- While low flow/drought episodes were
the focus, an effort was made to compile a set of
sequences representing a wide range of past (and
possible) streamflow behaviors, including high flow
sequences and periods with high amplitude variability.
- An emphasis was placed on defining 30-year sequences
in order to support long-term planning horizons.
The shorter sequences, some of which are embedded in the
30-year sequences, can be used to inject one or more
combinations of unique, extreme, shorter-term patterns
in exploratory drought scenarios.
- The
Streamflow Sequence Data
Spreadsheet (xls
file) contains reconstructed flow data for UCRB and SVT,
quantile visualizations, and graphs for each sequence.
Tree-ring based maps of reconstructed PDSI in western
North America (from the
the
North American Drought Atlas are included with the 7-year sequences.
Users can use the spreadsheet to select, plot, and/or
analyze additional sequences if desired.
|