G-7 EXPLORING THE DATA
(worth 10 points)
GROUP ASSIGNMENT FORM WITH
DIRECTIONS [pdf]
Part A - Data Exploration
Links:
Link #1: What's
Really Warming the World? (from
Bloomberg Business)
Link #2:
The Denial 101x Temperature Record Tool
(from Skeptical Science.com)
( Click on the
Temperature
Record Tool Tutorial for an overview of how
to use it )
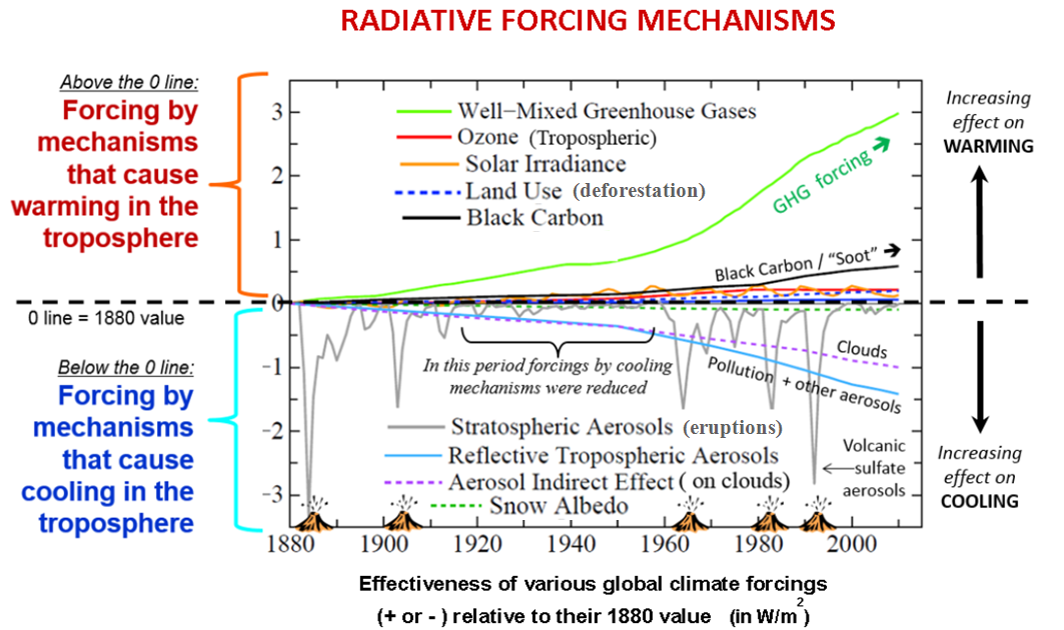
Radiative Forcing Figures
(color version of figures in
Class Notes)
CLICK HERE for larger views of the figures below
FIGURE 1

FIGURE 2
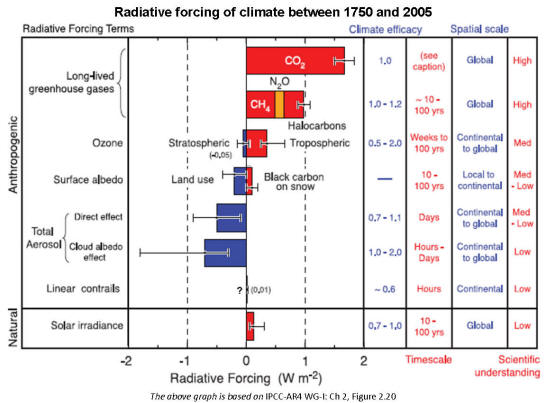
FIGURE 3
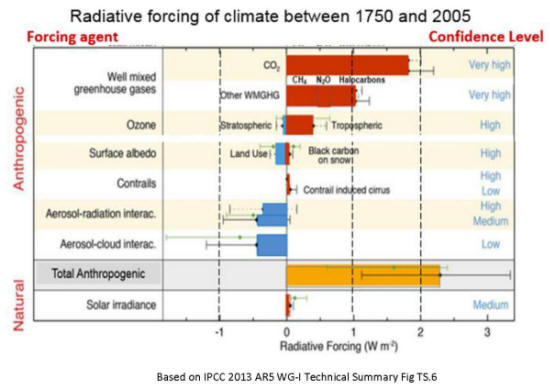
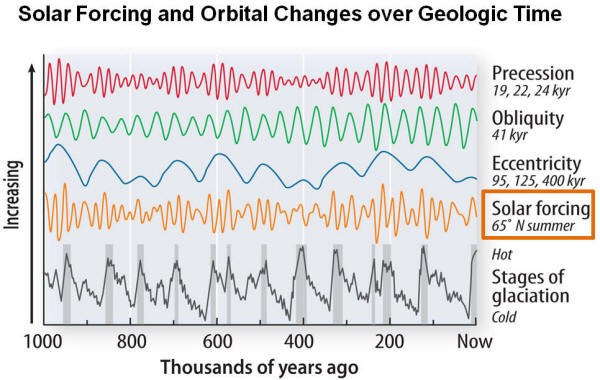
FIGURE 4
Major Volcanic Eruptions
List

Source: Robock, Alan, 2015:
Climatic impacts of volcanic eruptions,
FIGURE 5

Source: (SILSO data/image, Royal Observatory of Belgium,
Brussels)
http://www.sidc.be/silso/yearlyssnplot
FIGURE 6
Source: Fig 1.17 in
SGC E-Text Chapter 6
(originally from Kitchen, D.E.
(2014) Global Climate Change, Chapter 1)
FIGURE 7
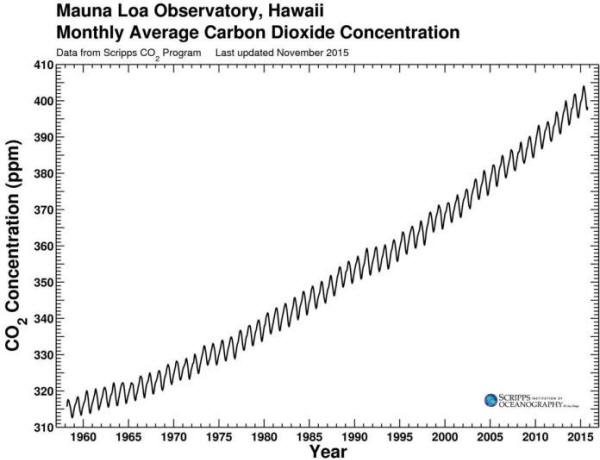
Source:
http://scrippsco2.ucsd.edu/graphics_gallery/mauna_loa_record/mauna_loa_record_smooth_curve
Part B - Data Exploration
Links:
Link #3 Climate
at a Glance (NOAA
National Center for Environmental Information)
Link #4
Gauging a Warming World
(Washington Post)
Link #5 A Year in the Life of Earth's CO2
(www.nasa.gov)
Link #6: Short Answers to Hard Questions About Climate Change (NYT
Science)
Link #7 What
You Can Do About Climate Change (The Upshot,
NYT)
FIGURE 8
How does what
I do contribute?
U.S. GHG Emissions Flow Chart
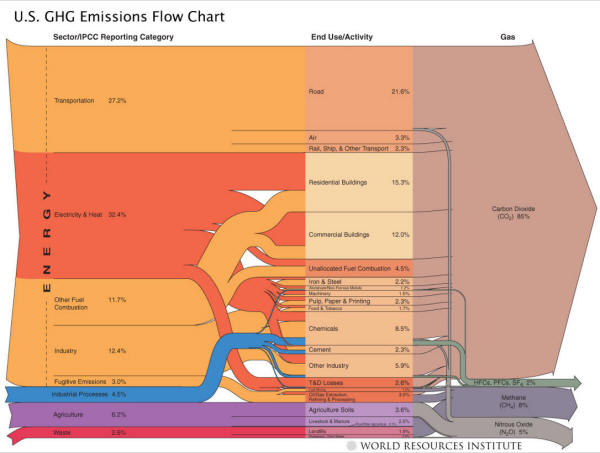
US human greenhouse
gas emissions
flowchart, from
the World Resources Institute.
For a "magnifying glass" look of the flow
chart go to:
http://www.skepticalscience.com/how-much-meat-contribute-to-gw.html
|